KubeHA provides high availability(99.999% and 99.9999%) to mission and business critical applications running in cloud native environment like Kubernetes. The applications can be either of type stateless and statefulset.
Stateless application: If a pod crashes, then there is no outage in stateless applications, but certainly there is service degradation. This degradation can last till a new replacement pod is started, which can take few seconds depending upon the type/size of a pod. Similarly, if a node(hosting many pods) crashes, then again there is a major service degradation. This degradation can last from 30 seconds to few minutes depending upon when node failure is detected by Kubernetes and pods are restarted again on the same or another node.
Statefulset application: If a master/active/primary pod crashes, then there is an outage in statefulset applications. This outage can last till the pod is restarted, which can take few seconds depending upon the type/size of a pod. Similarly, if a node(hosting master/active/primary pod) crashes, then again there is a major service outage. This outage can last from 30 seconds to few minutes depending upon when node failure is detected by Kubernetes and the node is restarted again. Node failure detection in any managed service provide(MSP like AWS, GKE, Azure, etc.) is more than 30 seconds and node recovery takes a few minutes.
For mission critical applications(esp. defence, 5G, etc.), one second of outage means a lot. Mission critical applications need to maintain high availability of 99.9999%(approx. 30 seconds of outage in a year). Business critical applications need to maintain high availability of 99.999%(carrier grade requirement, approx. 5 minutes of outage in a year).
In case of stateful business critical application, more than 1 node failure(recovery takes 2-3 minutes) in the year or at an average more than 2 pod failure(if takes 2-3 seconds) per week will violate SLA of 99.999% service availability. Mission critical application can’t tolerate node failure at all, one node failure will violate SLA of 99.9999% service availability. More than one pod failure per month will violate SLA of 99.9999% service availability.
|
Application Type |
Typical SLA |
Approx. Recovery Time |
SLA Violation |
|
Statefulset business critical application |
5 minutes i.e. 300 seconds of outage(Service Availability 99.999% ) |
Pod Recovery: 2.5 seconds Node Recovery: 2.5 minutes |
3 pods failure/week OR 2 nodes failure/week |
|
Statefulset mission critical(defence, 5G, etc.) application |
30 seconds of outage(Service Availability 99.9999%) |
2 pods failure/month OR 1 node failure/year |
In case of stateless business/mission critical application, service degradation will happen depending upon the scale of failure. Multi node failures can create outage in minutes.
Current application monitoring and alerting solutions require manual intervention for restoring the degraded service leading to longer recovery time and poor customer experience.
KubeHA has solved the problems of (pod/node)fault detection and the recovery time in native Kubernetes by implementing a combination of KubeHA side car containers and KubeHA instance.
KubeHA Dashboard:
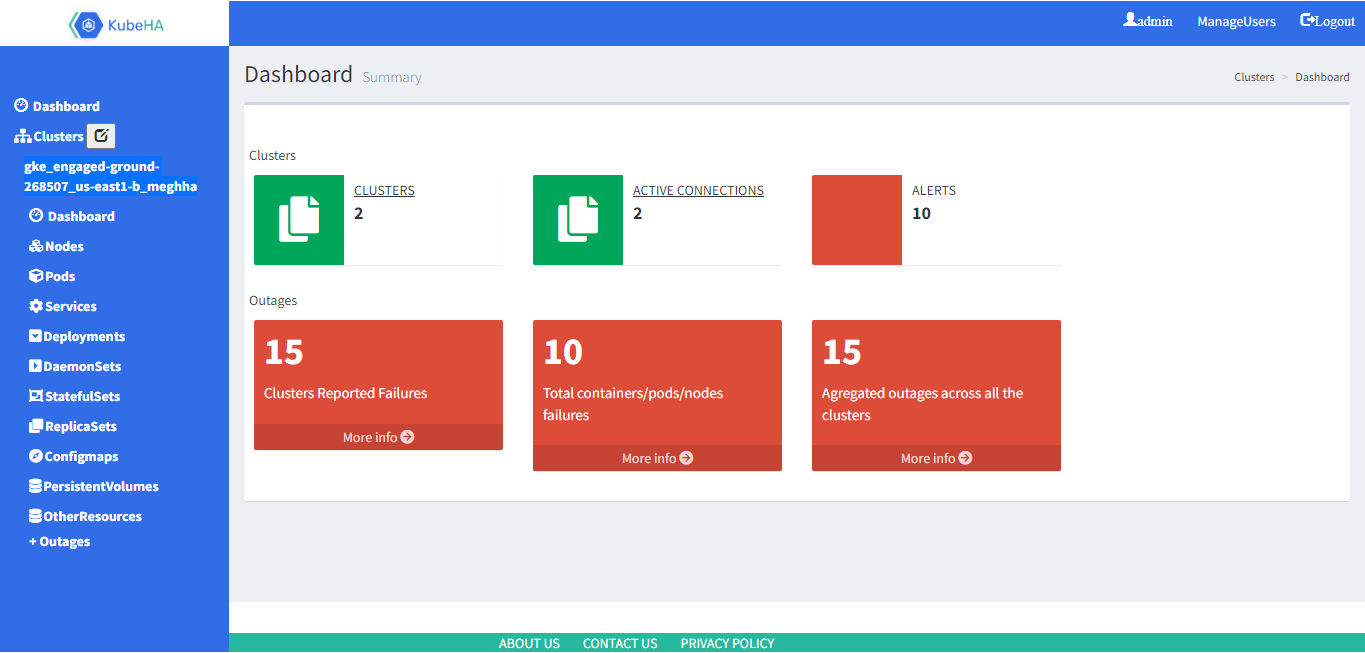
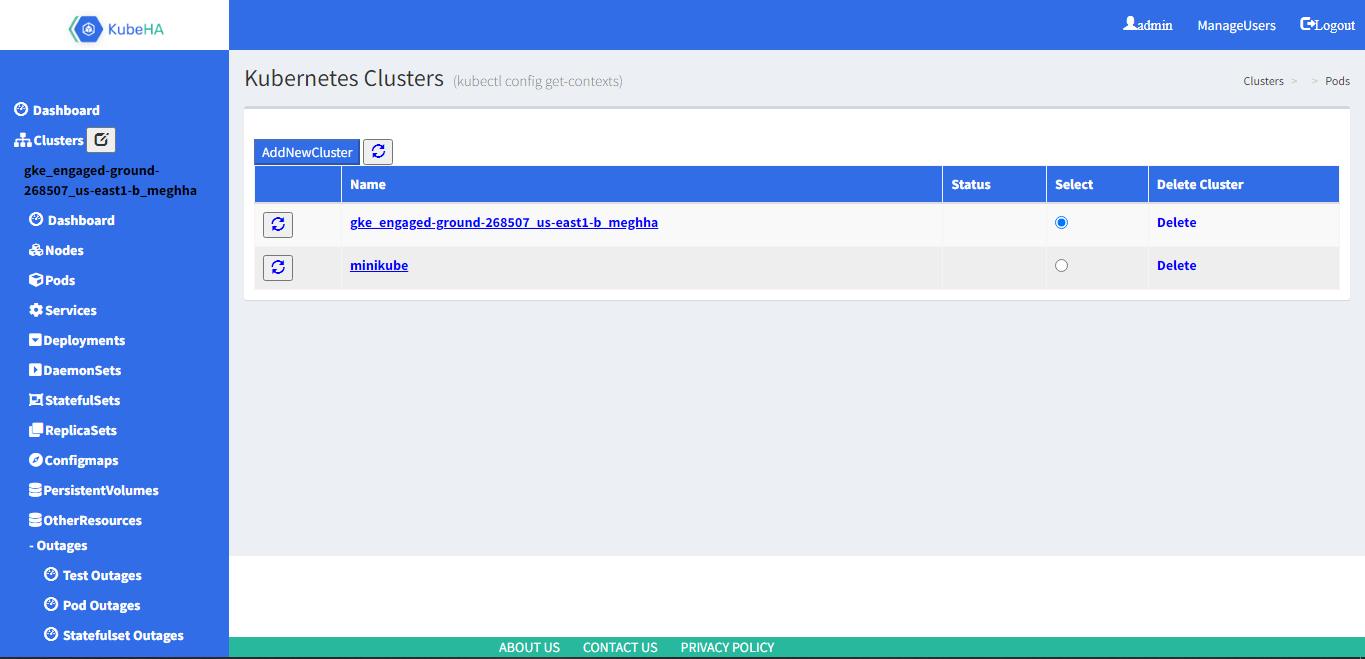
KubeHA Dashboard is a web-based user interface (UI) designed especially for monitoring and controlling multiple Kubernetes clusters. The dashboard can connect to multiple Kubernetes clusters.


The main advantage of KubeHA dashboard is making user’s integration effort with KubeHA to zero. The user can upload application’s yaml file, clicks ‘Monitor my deployment’, the dashboard automatically integrates user’s yaml file with KubeHA side car container’s yaml file and launches the application’s pod with KubeHA side car container. KubeHA instance gets started automatically and it starts monitoring the application’s pod using KubeHA side car container.


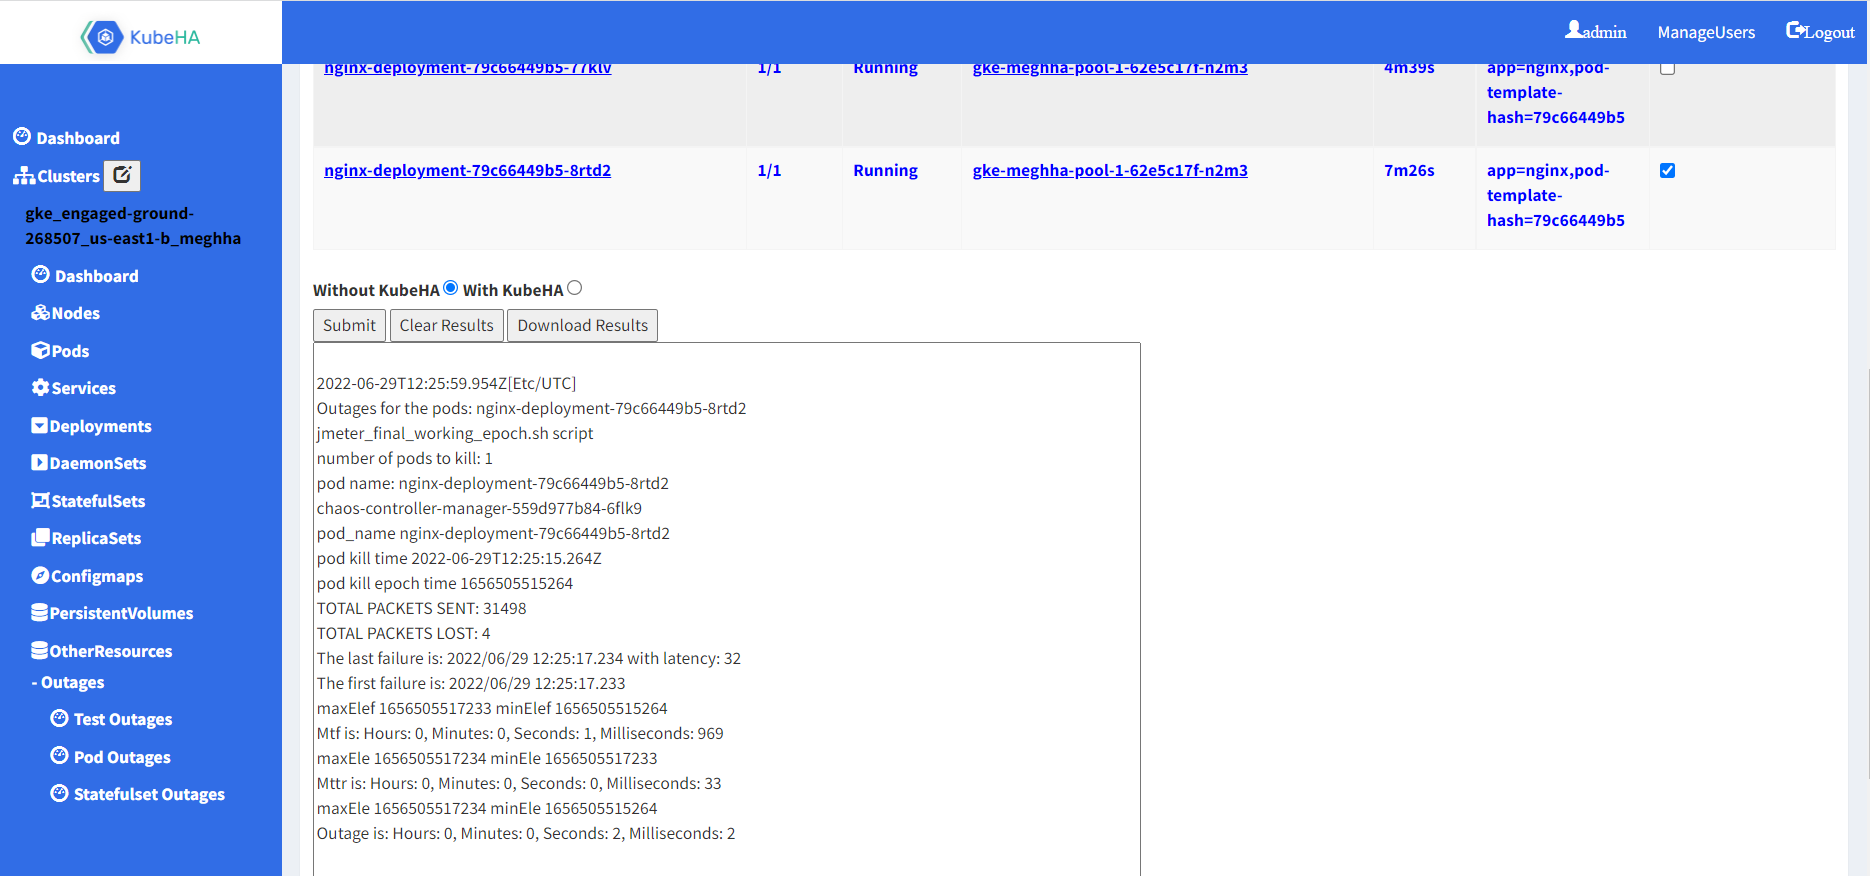
The dashboard can display all workloads and nodes running in any cluster. It also includes features that can help user to control and modify workloads. The dashboard helps in simulating few failures(pod failures, node failures, etc.) without/with KubeHA and displays the outages that these failures create in the cluster.
KubeHA Test Results:
- 1. Stateless Application:
- 1.1. Pod Failure:
Comparison of Service Outage for Single Pod (Stateless) failure: With KubeHA Vs Without KubeHA
|
MTTD (in Seconds) |
MTTR(in Seconds) |
Total Outage(in Seconds) |
|
|
Average service outage without KubeHA |
0.0537 |
3.2236 |
3.2773 |
|
Average service outage with KubeHA |
0.0452 |
0.0384 |
0.0836 |
|
Comparative Service Outage (Without KubeHA /With KubeHA) |
1.188 times faster |
83.94 times faster |
39.20 times less outage |
- 1.2. Node Failure
Comparison of Service Outage for Single Node failure (Stateless Pods): With KubeHA Vs Without KubeHA
|
MTTD(in Seconds) |
MTTR(in Seconds) |
Total Outage(in Seconds) |
|
|
Average service outage without KubeHA |
37.2 |
2.858 |
40.58 |
|
Average service outage with KubeHA |
5.374 |
0.187 |
5.561 |
|
Comparative Service Outage (Without KubeHA /With KubeHA) |
6.92 times faster |
15.28 times faster |
7.29 times less outage |
- 2. Statefulset Application:
- 2.1. Master/Active/Primary Pod Failure:
Comparison of Service Outage for Pod (StatefulSet) failure: With KubeHA Vs Without KubeHA
|
MTTD (in Seconds) |
MTTR(in Seconds) |
Total Outage(in Seconds) |
|
|
Average service outage without KubeHA |
0.0268 |
1.4348 |
1.4616 |
|
Average service outage with KubeHA |
0.005 |
0.4014 |
0.4064 |
|
Comparative Service Outage (Without KubeHA /With KubeHA) |
5.36 times faster |
3.57 times faster |
3.59 times less outage |
2.2. Node(hosting Master/Active/Primary Pod) Failure:
Comparison of Service Outage for Pod (StatefulSet) because of Node failure: With KubeHA Vs Without KubeHA
|
MTTD(in Seconds) |
MTTR(in Seconds) |
Total Outage(in Seconds) |
|
|
Average service outage without KubeHA |
36.7023 |
121.081 |
157.7833 |
|
Average service outage with KubeHA |
3.4177 |
0.781 |
4.1987 |
|
Comparative Service Outage (Without KubeHA /With KubeHA) |
10.738 times faster |
155 times faster |
37.579 times less outage |


